Qlik Replication Sensation

The blog discusses and demonstrates a seamless flow of data from a singular Uninterrupted Power Supply (UPS) source to multiple on-premise databases, and the data replicated to a unified Snowflake cloud database, without extensive coding.
The Challenge
Store data that is being generated from a single Uninterrupted Power Supply (UPS) to multiple on premise PostgreSQL databases then replicate that same data to a single Snowflake database in the cloud. Build a deluxe dashboard with the replicated data.
‘It’s at this point you realise you’re about to ‘set and forget’ replication and change data capture technology between two different branded databases, both of which support different functions that aren’t even on the same network – all without having written a single line of code.’
Why?
We wanted to simulate a scenario whereby live data was being stored across multiple databases and demonstrate how its possible to combine them into one with hardly any scripting or coding. This type of deployment is typical in most organisations where data from various programs and IoT devices are siloed into their own databases, each with their own language and syntax.
Whilst there’s nothing typically bad about that from an architectural or networking standpoint, it does often raise the anxiety levels of analysts and developers who need to report on that data.
How does one avoid the agony of writing multiple queries, potentially in different languages, whilst maintaining their faculties?
Tech Used
- APC 3000 Smart-UPS
- Node-RED
- PostgreSQL
- Qlik Cloud Data Integration (QCDI)
- Snowflake
- Qlik Cloud Data Analytics
Data Source
To generate some data, we used the APC 3000 Smart-UPS. A UPS typically produces a treasure chest of information such as battery levels, load, temperature and is a great example of an IoT device.
Data Collector
As there was no way to directly store the data from the UPS to a conventional database, we used Node-RED to bridge the gap and read MIB data from the UPS. A Node-RED flow read the UPS and stored readings at 10 second intervals to on premise databases.
Data Storage
We used PostgreSQL for our on premise databases. In total, we had 14 separate PostgreSQL databases to simulate an environment that consisted of multiple data sources. Node-RED was configured to store data to one database, then 10 seconds later store data to the next database in line incrementally.
Centralised Database
To store our on premise data in the cloud, we used an instance of Snowflake that allowed us to combine all 14 on premise PostgreSQL databases into one single cloud database.
Data Replication
To replicate our on premise data to the cloud, we leveraged the data replication facility provided by Qlik Cloud Data Integration (QCDI). Using Change Data Capture (CDC) we were able to move live data from on premise to the cloud, without the need to copy full tables at scheduled intervals.
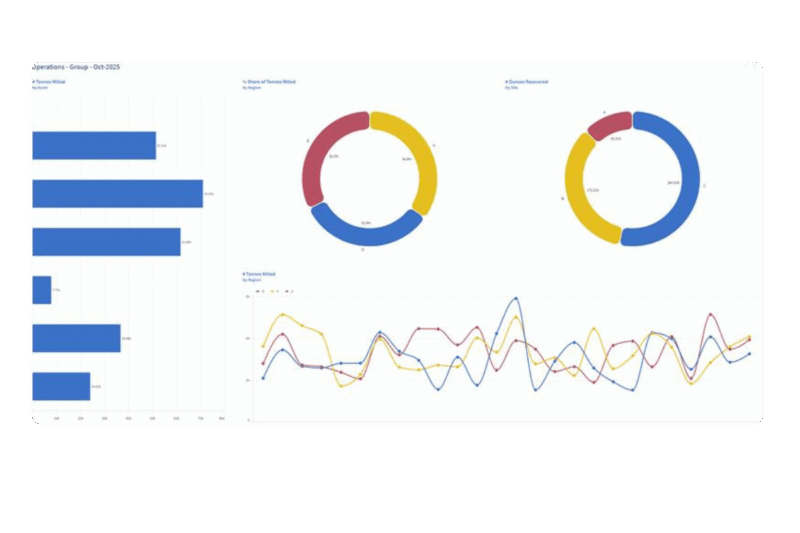
Dashboard
To show all that data in the one place we used the Qlik Sense component of Qlik Cloud Data Analytics (QCDA). This allowed us to build an application bearing the usual ‘health status’ hallmarks of a dashboard
What We Did
Before we got stuck into the project, we plotted how the data should move through each step, from on premise data to cloud based dashboard.

From Farm to Table
But we needed this visualised and with the ability to focus on individual databases once it had been consolidated.

With 14 PostgreSQL databases running hot, we began setting up the Qlik side of the process by deploying a gateway that sits on premise and behind a firewall. This acts like an agent that sits on a CentOS box which allows you to talk to on premise databases. It’s one way traffic in an outbound direction, so there’s minimal risk of inbound hostilities.
Having deployed the agent on home soil, the gateway in Qlik Cloud can now be set up to allow chit chat between on premise and the cloud. It’s now just a matter of leveraging the gateway to set up individual connections to each instance of Postgres. Put simply, one gateway can equal many connections rather than having one gateway setup for each connection.
To land our data into the cloud, we just need one more connection and a destination database. For this we chose an instance of Snowflake, setup a single Snowflake connection in Qlik then switched gears to begin building the replication tasks inside of Qlik’s Data Integration facility.
At this point, we’ve established a road from our on premise databases, to our cloud database. To get the data moving along, we just need to give it a motor – not a unicycle.
Replication Sensation

Qlik Cloud Data Integration provides a ‘point and click’ pipeline, to onboard, land and store your data. As far as getting data from on premise to the cloud is concerned, this is the final part to the machine.
A new project was setup within the Data Integration component of Qlik Cloud. We then proceeded to onboard the data which mainly involves:
- Selecting a Postgres database and which tables we want to replicate
- Tell it where the data will be replicating to ie. Snowflake database
- Configuring the Landing and Storage schemas
It’s at this point you realise you’re about to ‘set and forget’ replication and change data capture technology between two different branded databases, both of which support different functions that aren’t even on the same network – all without having written a single line of code.
Rinse and repeat with each database and the pipeline starts to take shape.
As far as replication and change data capture is concerned, this is essentially all that’s required to move data around.
Some additional magic at the end of the pipeline combined every Postgres database into one schema, all still within the single instance of Snowflake. A small Snowflake query based script was needed here to concatenate the tables together, however there’s nothing stopping you from performing this action in the reporting tool at the end of the chain, outside of Qlik’s Data Integration.
Dashboard
As there’s not really any charts in Qlik Sense that resemble a UPS, we decided to take advantage of the Map object which is an out of the box feature. Map objects are typically used for, well.. A map. But they also allow you to use custom background layers instead of showing a conventional street map.
The map object needed two layers, one for the SVG image of the front panel as a background and an area layer for the LEDs to light up. The LEDs were configured in KML format, and plotted over the top of the background layer to show Load, Status and Battery Capacity.
In retrospect, the SVG layer could have been (and will be in the future) swapped out and replaced with a KML layer. SVG requires a bit of fine tuning in the settings of the map object to display correctly whereas KML is much more straight forward. Our eccentric boss wants to take it a step further and get the whole lot configured using a tile server in house. That’ll be a write up for another day once some sleep has been returned.
The remaining visuals for the dashboard are a bit more conventional, gauges for Temp, Load and Battery with Status and Minutes Remaining represented as a bar and line chart respectively.
Of course, no dashboard is complete without some sort of ‘Hey look at me! Something is wrong!‘ element. Based on whether or not the UPS was supplying battery power, a simple text object displaying the status of the UPS, with a colour code to match, was all that we needed. Green meant that the UPS was receiving mains power, red meant that there was no mains power and that it was on battery. ie do something about it quickly.
TL;DR
We built a Qlik Sense dashboard with data originally spread out across multiple on premise databases that had been replicated to a single cloud database with Qlik Cloud Data Integration technology.